New Forum

Visit the new forum at http://godelsmarket.com/bb

Thursday, September 27, 2012

SPY Intraday Mondays

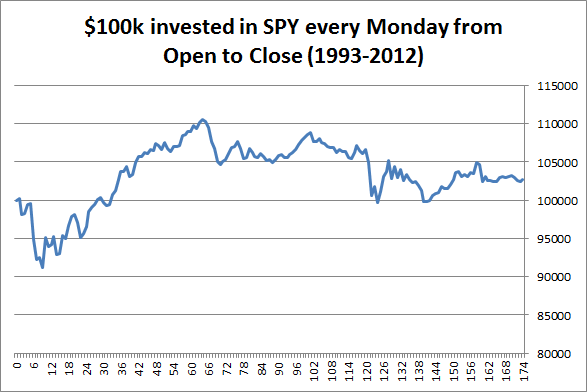
I have been doing a little research into the peculiarities of certain days of the week. For instance, Monday's tend to have very little economic news released intraday and very few earnings release or reports. You might expect 2008 to have some large intraday turbulence on Mondays, given government reports released over the weekends. But this is not the case. In face, the largest down day on a Monday since 1993 has been approx -4.7% and took place during 2009. The largest up day is 4.3% and also took place during 2009.

Here's a chart displaying the return of $100,000 placed into the SPY at its open on Monday morning and taken out of the SPY at its Monday close. Rather uneventful.


Wednesday, September 26, 2012

Minutes per Price Chart

To compliment yesterday's post, here's a chart displaying the minutes spent at each price level.

(Note: This is for AAPL between 7/17/2012 and 9/21/2012)

Tuesday, September 25, 2012

Using SQL to Generate Volume by Price

Sometimes you may want to know at which dollar level the most trades have taken place in your favorite stock. Here's an easy way to do this in MySQL using a simple SQL query:

SELECT ROUND(close,0), SUM(volume) FROM stocks.stock_prices_minute
WHERE SYMBOL = 'AAPL'
AND DATE(date) = '2012-09-21'
GROUP BY ROUND(close, 0)

Above, 'close' is the name of the column with 1-minute (or whatever you have) close prices, 'volume' is the name of the column with volume data, stocks is the database, and stock_prices_minute is the table.

Here's a graph of a similar query (I removed the date requirement in order to get all data within the period I had available).

Tuesday, September 18, 2012

Placing an Order Through Interactive Brokers API

This is one way to place an order through IB's API using ibPy and Python 2.7.

It places a 'SELL' order for 2 'YM' contracts with expiry '20120921'. Also, 'YM' is on the 'ECBOT' exchange, so, if you want to trade a different future check to see what its exchange is. You can't just change 'YM' to 'ES', for instance. You also have to change 'ECBOT' to 'GLOBEX'.

Also, remember to update your orderID each time you send an order. If you put this into a program you can have it auto-increment after each order. In this simple script, you'll have to do it by hand.

And, if you want to put in a limit order you can change 'MKT' to 'LMT' and make sure you put in a m_lmtPrice, i.e. a limit price. I have it commented out with '#' right now. But it's an easy adjustment.

from ib.ext.Contract import Contract
from ib.ext.Order import Order
from ib.opt import ibConnection, message

sym = 'YM'
shares = 2
action = 'SELL' 
orderID = 3

def makeStkContract(sym):
    contract = Contract()
    contract.m_symbol = 'YM'
    contract.m_secType = 'FUT'
    contract.m_expiry = '20120921'
    contract.m_exchange = 'ECBOT'
    contract.m_currency = 'USD'
    return contract

def makeStkOrder(shares,action):
    order = Order()
    order.m_minQty = shares
#    order.m_lmtPrice = limit_price
    order.m_orderType = 'MKT'
    order.m_totalQuantity = shares
    order.m_action = str(action).upper()
    return order

con = ibConnection()
#con.registerAll(watcher)
con.connect()

stkContract = makeStkContract(sym)
stkOrder = makeStkOrder(shares, action)
con.placeOrder(orderID, stkContract, stkOrder)

con.disconnect()
Tuesday, September 4, 2012

Volume vs Range

I've been reading some TraderFeed (this post for instance) recently and Dr. Steenbarger often mentions the relationship between Volatility and Volume. I did a simple study and present the data in the charts below. What I consider as Volatility is the Range for the day (the change between high and low). Volume is, just that, volume. In any case, the past few years has shown remarkable correlation.

(average volume has fluctuated over time and increased significantly from 1993)


Now, of course, it would be interesting to take the first 5,10, 15, 30mins, or hour of volume and see if that in any way correlates to the range expected for the rest of the day. I'm guessing it does. But I'll have to wait on that study until I have a bit more data.

Monday, September 3, 2012

Overnight Edges

I've followed Quantifiable Edges for years. One of my previous posts commented on his interesting, insightful and useful book on Fed Edges. It is always a pleasure to read his work, which is why I am so excited that he has a new site. I highly recommend watching the video below, and checking out his new site OvernightEdges.com.

Your brokerage account will thank you.

Saturday, September 1, 2012

System Trades with Huge Profit Potential

If you've been following this blog and my other trading blog, you know I've been working on a systematic trading strategy that I can passively implement. Here are the results of what appear to be a consistently exploitable inefficiency in a certain large (~5mil average daily volume) stock. The strategy is relatively simple and easy to execute. It is based off of taking advantage of supply inefficiencies.

There is a short strategy and a long strategy (both on the same stock). Below are the results (starting with $25,000):


I'm not going to post the method I used (which, is also good on a number of other stocks--typically movers--and the indices), but if you would like to purchase a guide explaining the statistical findings, I'd be happy to share. 

Of course, I am only presenting information on a situation and not on how to react to that situation. I cannot give financial advice and any action you take is your responsibility. 

Leave a comment if you'd like more information!